
Track one Claude Code session
The status line shows which models served turns during the session. Each segment is sized by its share of estimated cost.
Session cost, model mix, and cache share in Claude Code
Break down Fireworks usage and cost
Use the usage dashboard to break down Fireworks traffic by model, user, or API key over the selected date range. The Cost view groups Fireworks account spend by model: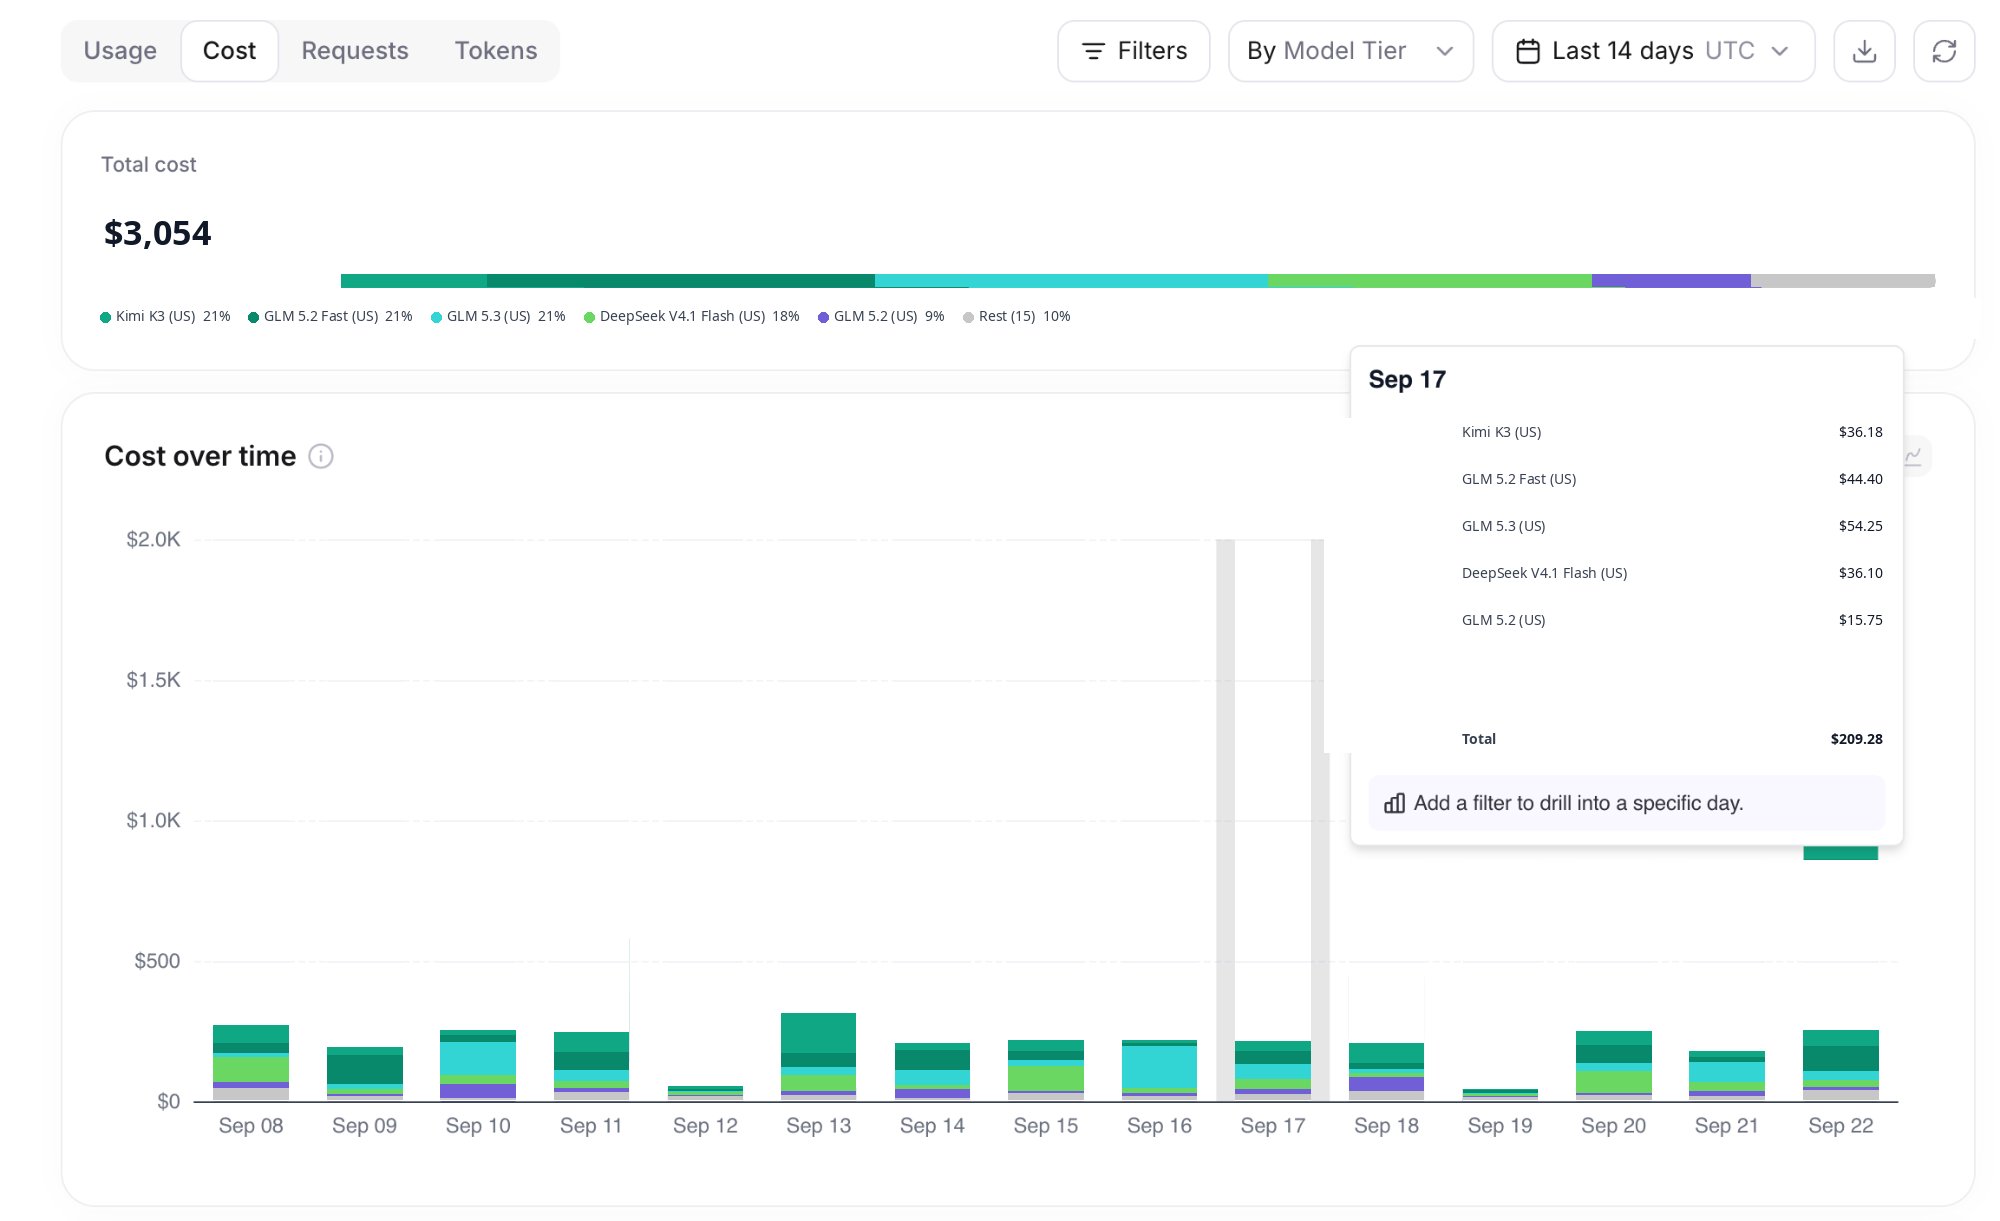
Account cost by model. Names and amounts are illustrative.
The account dashboard covers Fireworks model usage and cost. It does not include usage billed by closed-model providers.
Know which number you are reading
- Session meter: a local estimate from token counts and published model rates.
- Usage dashboard: Fireworks model usage and cost for the selected range.
- Billing page: the source of truth for the Fireworks invoice.