
- Open it at Analytics → Savings.
- Only account admins on Nexus-enabled accounts can view it.
- It counts direct Fireworks serverless usage and Nexus Auto turns, including turns that went to a closed model.
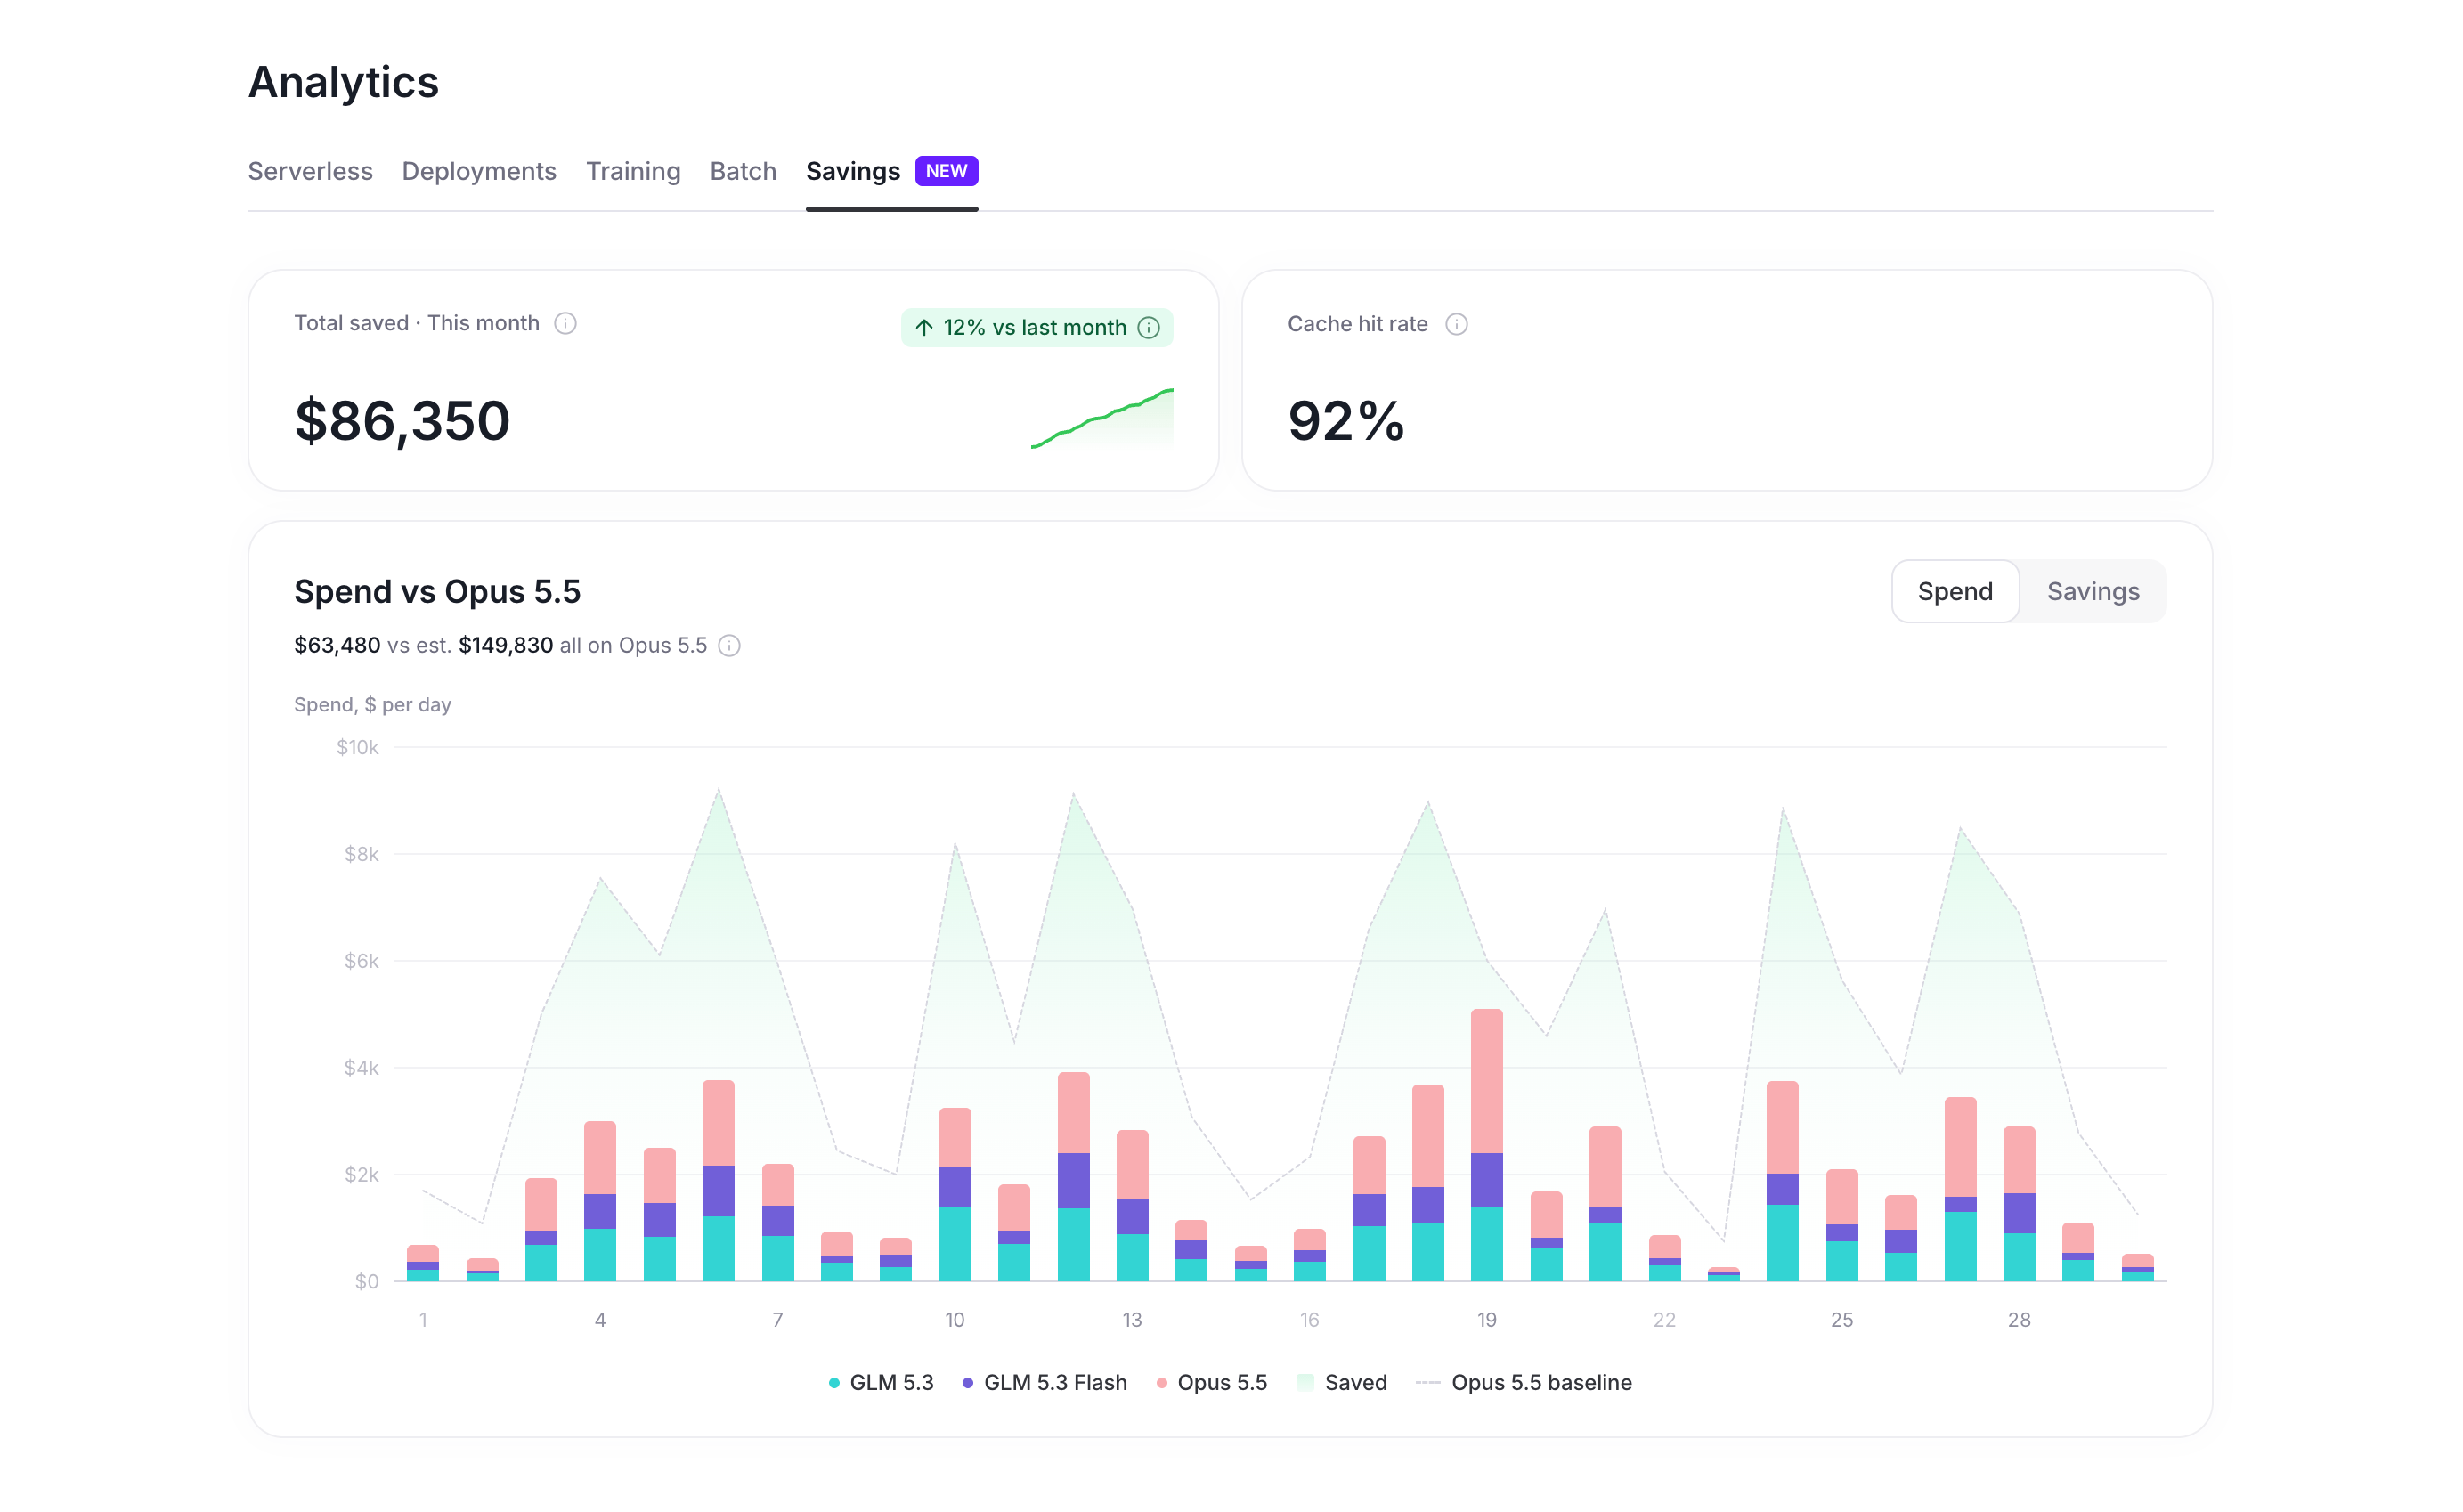
The Savings view, with example data.
How savings are calculated
- Actual cost: the models that served the requests, at public list prices.
- Baseline cost: the same tokens on Claude Opus 5.5.
What’s included
- Included: Fireworks-hosted serverless models, closed models called through Nexus Auto, and direct eligible Fireworks serverless requests.
- Not included: dedicated deployments, and discounts, credits, taxes, negotiated rates, or other invoice adjustments.